- NQrack 💉💉💉
- Posts
- [nqrack] What i'm looking at this week - Nasdaq (MNQ/NQ/QQQ) 2025.03.30
[nqrack] What i'm looking at this week - Nasdaq (MNQ/NQ/QQQ) 2025.03.30
It's the beginning of the month, i'm feeling a lil spicy, let's dig in. This one may be worth taking a look at if you're truly interested in
n qracky
March 30, 2025

Big Picture: QQQ
We are back in our downtrend. It’s obvious that Bears are currently in control. QQQ has dropped below 2024’s VAH again, but closed above VAL, which would appear they’d like a potential reversal situation forming…
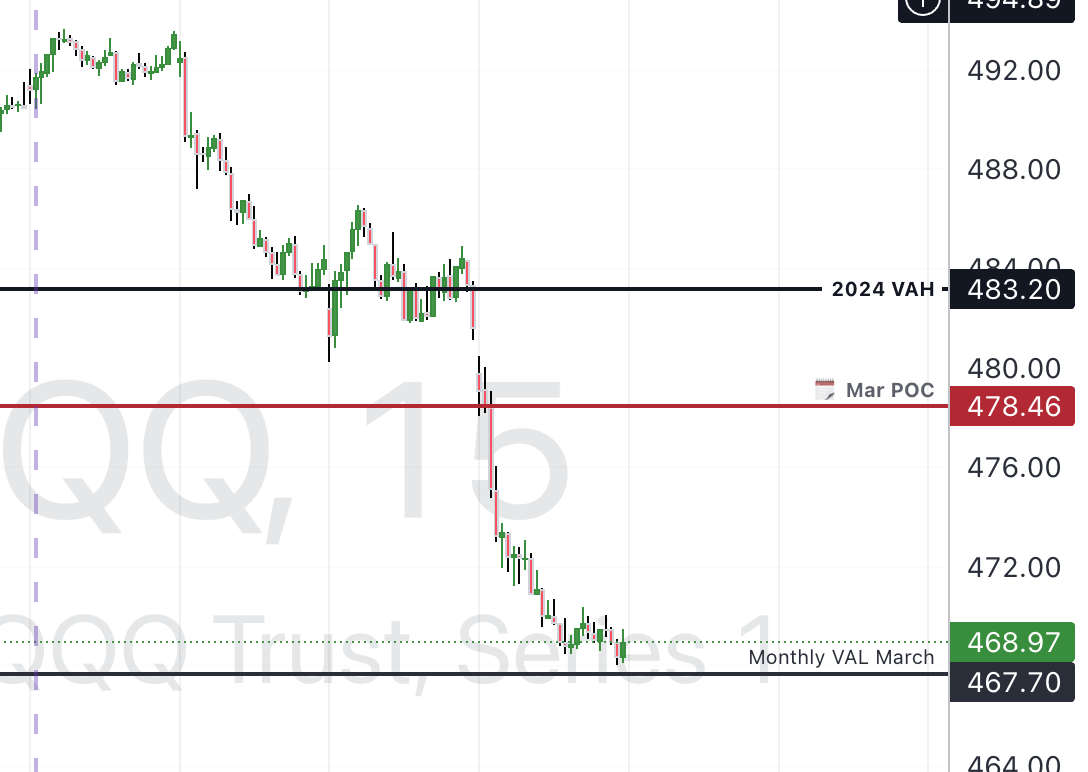
But like the scoundrels they are, dropped it below after hours.
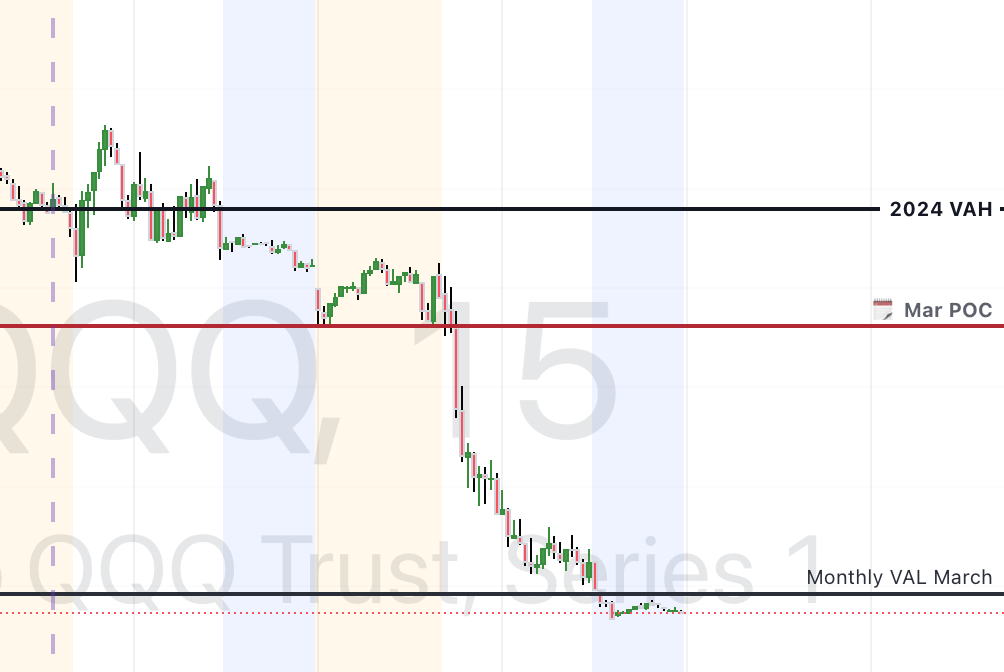
But wait…I’ve seen this kind of drop before, shape wise (I’ve dubbed it the “boot formation”), and it can mean a gap up at the night open. It’s hard to imagine not gapping one way or another at the open, either way. I guess we’ll know at 6pm EST. I’ll be watching.
OK onto [M]NQ
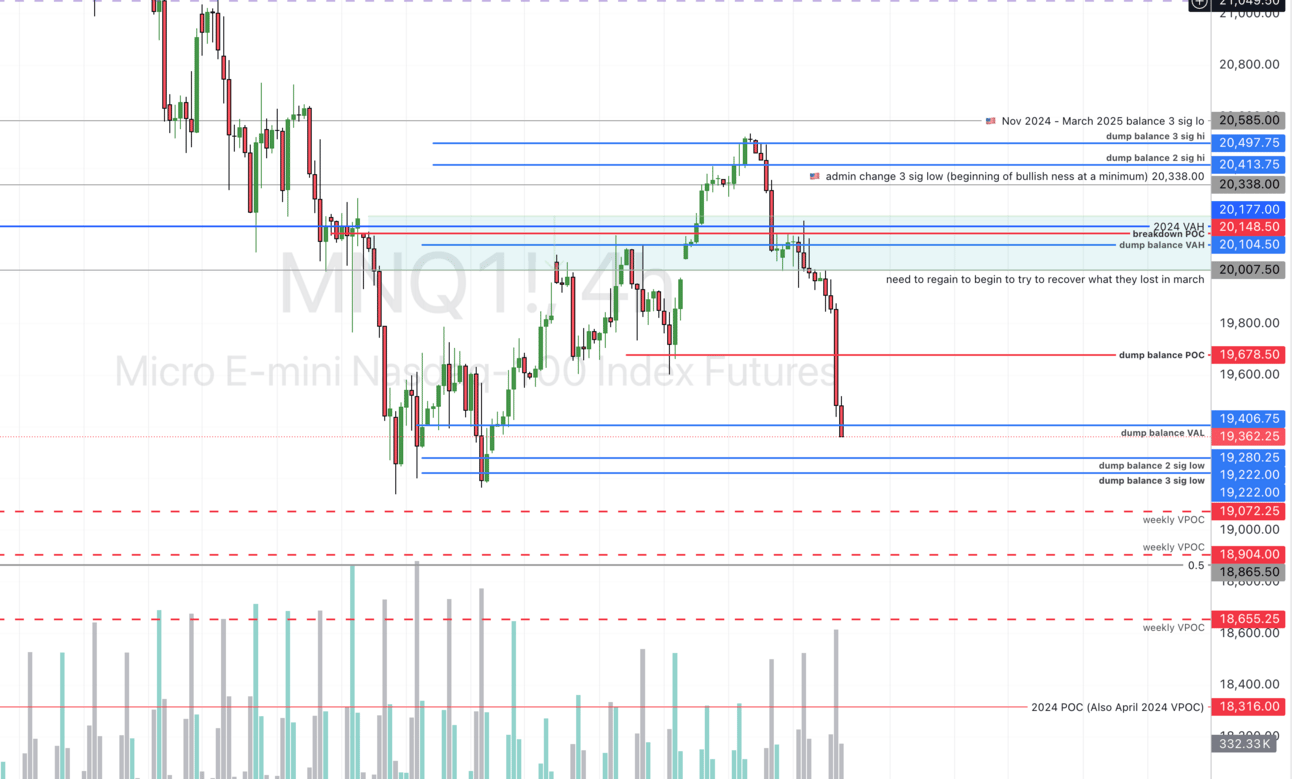
NQ couldn’t break out of our upper box last week, and began to fall out of it altogether, back into the balance; in fact, she closed pretty much near the bottom of the balance. As well, the higher volume days were our red days. So that said, I wouldn’t be surprised if she gapped down and finished the job. And if she doesn’t gap down, I still wouldn’t be surprised if she finished the job this week, at a minimum, and we’ll end up recognizing Friday’s close as a higher low just as fast as she rockets up.
First — understanding Tuesday’s dump.
I want to explain something about Tuesday’s dump. While eventually turning out to be “severe”, it was certainly not unexpected. Personally I kinda enjoyed seeing everyone calling the bottom eventually get freaked out, while simultaneously hoping they didn’t lose too much…i’m not a complete goober.
Monday and Tuesday, they were able to work their way into a critical box that i won’t re-explain, as I’ve mentioned it in other newsletters. Furthermore, they were faced with surpassing a larger breakdown area that would have, in my view, put them back into the beginning of full bullish territory, as it’s the 99th percentile low end range of the “Trump Pump”.
The following is something i’ve seen often, and I’m sure others call it other things..in fact i’ve heard it called “breakdown box”, but never with specific levels, but I’ll show you how you can get specific sizing for that box. This is my own way of doing this, I’m certain it’s not unique, or else I wouldn’t have been able to make many good trades from it. 🙂 It’s simply the volume profile across any previous consolidation area before a move. POC is often a place to look for a turn. Sometimes its an initial tap (i’ve seen it to the penny), and many times it’s a look above and fail (which sometimes can be more powerful, as it’s character isn’t that of a pullback as much as an all-out rejection of higher prices). If they look above, and fail, the retest of that POC can often be a good short (or put level on the corresponding QQQ), with stop loss, if you can hack it, above the VAH of the same area (which will help you determine whether or not your sizing or whether or not to take the trade in the first place.
At the very least, you’ll see a retest of the bottom of that breakdown range (i actually have 99% set, so on the below chart it’d have been higher than the bottom level pictured), but boy did we end up getting a whopper by the end of the week, back into the range, all the way nearly to the bottom. A note: It may be argued that the safest entry is at the edge of the box (i.e. the VAH or sigma levels, depending on when that consolidation was made, really)…this is why it’s often more of an art than a science) — stocks/indices calls/puts are one thing, futures another, with regards to risk. And it’s also why i love discretionary trading. If it were completely easy, would it be worth it? :)
Speaking of the bottom of that breakdown range…
I expect some defense at the bottom of the balance. Whether it holds depends, especially there’s news that seems to be a catalyst to push it lower quickly (tariffs, anyone? stagflation fears?), and if that’s the case, we have some former weekly VPOCs from 2024 to hit, we have a halfback between our dump balance VAL to 2024 POC (for the keen, that 2024 POC has been revised/corrected) from an earlier level we never made it to…oof
About that halfback.
TLDR: look out for that level as a potential reversal when they get there, if they’re not interested in making it all the way to the POC.
Details: How did I come up with that particular halfback? This is more of an art than a science sometimes, but I’ve come to trust my fibs, especially when I find confluence.
First let me quickly try to explain halfback for those uninitiated — the halfback refers to a phenomena you see in trading often, between two levels, where half of the move gets retraced, or becomes a full reversal. I usually will use it when I have multiple positions as either an exit point, or one to watch. And I’m clearly not the only one (hence the phenomena). Especially when there is a long distance between two levels. In technical terms, it refers to the 0.5 retracement in a fibonacci sequence. Here’s a less than one minute video that hopefully shows how I came up with this particular halfback, using the fibonacci tool:
Summary
In summary, as you know, anything can happen. 🙂 I’m anticipating a gap in either direction. If so, then mind it.. she could finish the job downward, reverse for an equal or higher low, and continue to attempt to push up this week one more time, or, it’s completely possible that we begin transacting below. I am anticipating being range-bound again overall this week, but looking for breakouts below prior lows for continuation, and breakups of March VAL at a minimum for a bit to remain optimistic that they’re even trying higher again. As it stands, our current situation of being below 2024 VAH is quite weak, especially after that attempt up, so I am bracing for lower numbers below, at least for a spell. All of that said, you know how they love to run it when we’re not looking, and dump it when everyone thinks we’re in the clear so…stay vigilant.
Notable Events
Plenty of news/events this week that can move markets, so pay attention!
4/1/2025, 10:00:00 AM | US | JOLTs Job Openings |
4/1/2025, 10:00:00 AM | US | ISM Manufacturing PMI |
4/3/2025, 10:00:00 AM | US | ISM Services PMI |
4/4/2025, 8:30:00 AM | US | Unemployment Rate |
4/4/2025, 8:30:00 AM | US | Non Farm Payrolls |
4/4/2025, 11:25:00 AM | US | Fed Chair Powell Speech |
Here’s to learning, patience (lots of patience please!) and profits! See you in the tweets.
Link to this week’s chart (including previous week value areas, monthlies, and friday’s!)
https://www.tradingview.com/chart/b1x55X8a/